Total tax
Federal + provincial income tax attributed to the bonus, plus employee payroll premiums on the incremental income.

Compare annual incremental tax on bonuses across Canada. Rankings use C$10,000 bonus on C$80,000 annual salary (single, no dependents). Not the US flat supplemental rate.
By Sammy S. · Founder · AuthorUpdated for 2026
$3,917.00
Highest total tax (NS)
$2,950.00
Lowest total tax (NU)
13
Provinces & territories
20
Curated pair pages
$967.00
Largest featured corridor ≈ $689.75
Key finding: Nova Scotia has the highest total tax at $3,917.00 (39.2%); Nunavut is lowest at $2,950.00 — about $967.00 apart.
Head-to-head
Side-by-side annual incremental tax on C$10,000 bonus on C$80,000 annual salary (single, no dependents).
Compare any two provinces
Annual incremental tax on a C$10,000 bonus with C$80,000 salary.
All provinces & territories
Total incremental tax on C$10,000 bonus on C$80,000 annual salary (single, no dependents) across all 13 provinces and territories. Rank #1 = highest total tax (federal + provincial + payroll premiums). Figures are annual T1-style estimates from our engine — not CRA T4032 lump-sum withholding.
| Rank | Province | Provincial | Total tax | Net bonus | Compare |
|---|---|---|---|---|---|
| #1 |  Nova Scotia Nova Scotia | $1,667.00 | $3,917.00 | $6,083.00 | vs NB |
| #2 |  Prince Edward Island Prince Edward Island | $1,660.00 | $3,910.00 | $6,090.00 | vs QC |
| #3 |  Quebec Quebec | $1,900.00 | $3,854.75 | $6,145.25 | vs ON |
| #4 |  Newfoundland and Labrador Newfoundland and Labrador | $1,458.40 | $3,708.40 | $6,291.60 | vs NS |
| #5 |  New Brunswick New Brunswick | $1,400.00 | $3,650.00 | $6,350.00 | vs NS |
| #6 |  Manitoba Manitoba | $1,275.00 | $3,525.00 | $6,475.00 | vs SK |
| #7 |  Saskatchewan Saskatchewan | $1,250.00 | $3,500.00 | $6,500.00 | vs MB |
| #8 |  Alberta Alberta | $1,000.00 | $3,250.00 | $6,750.00 | vs ON |
| #9 | 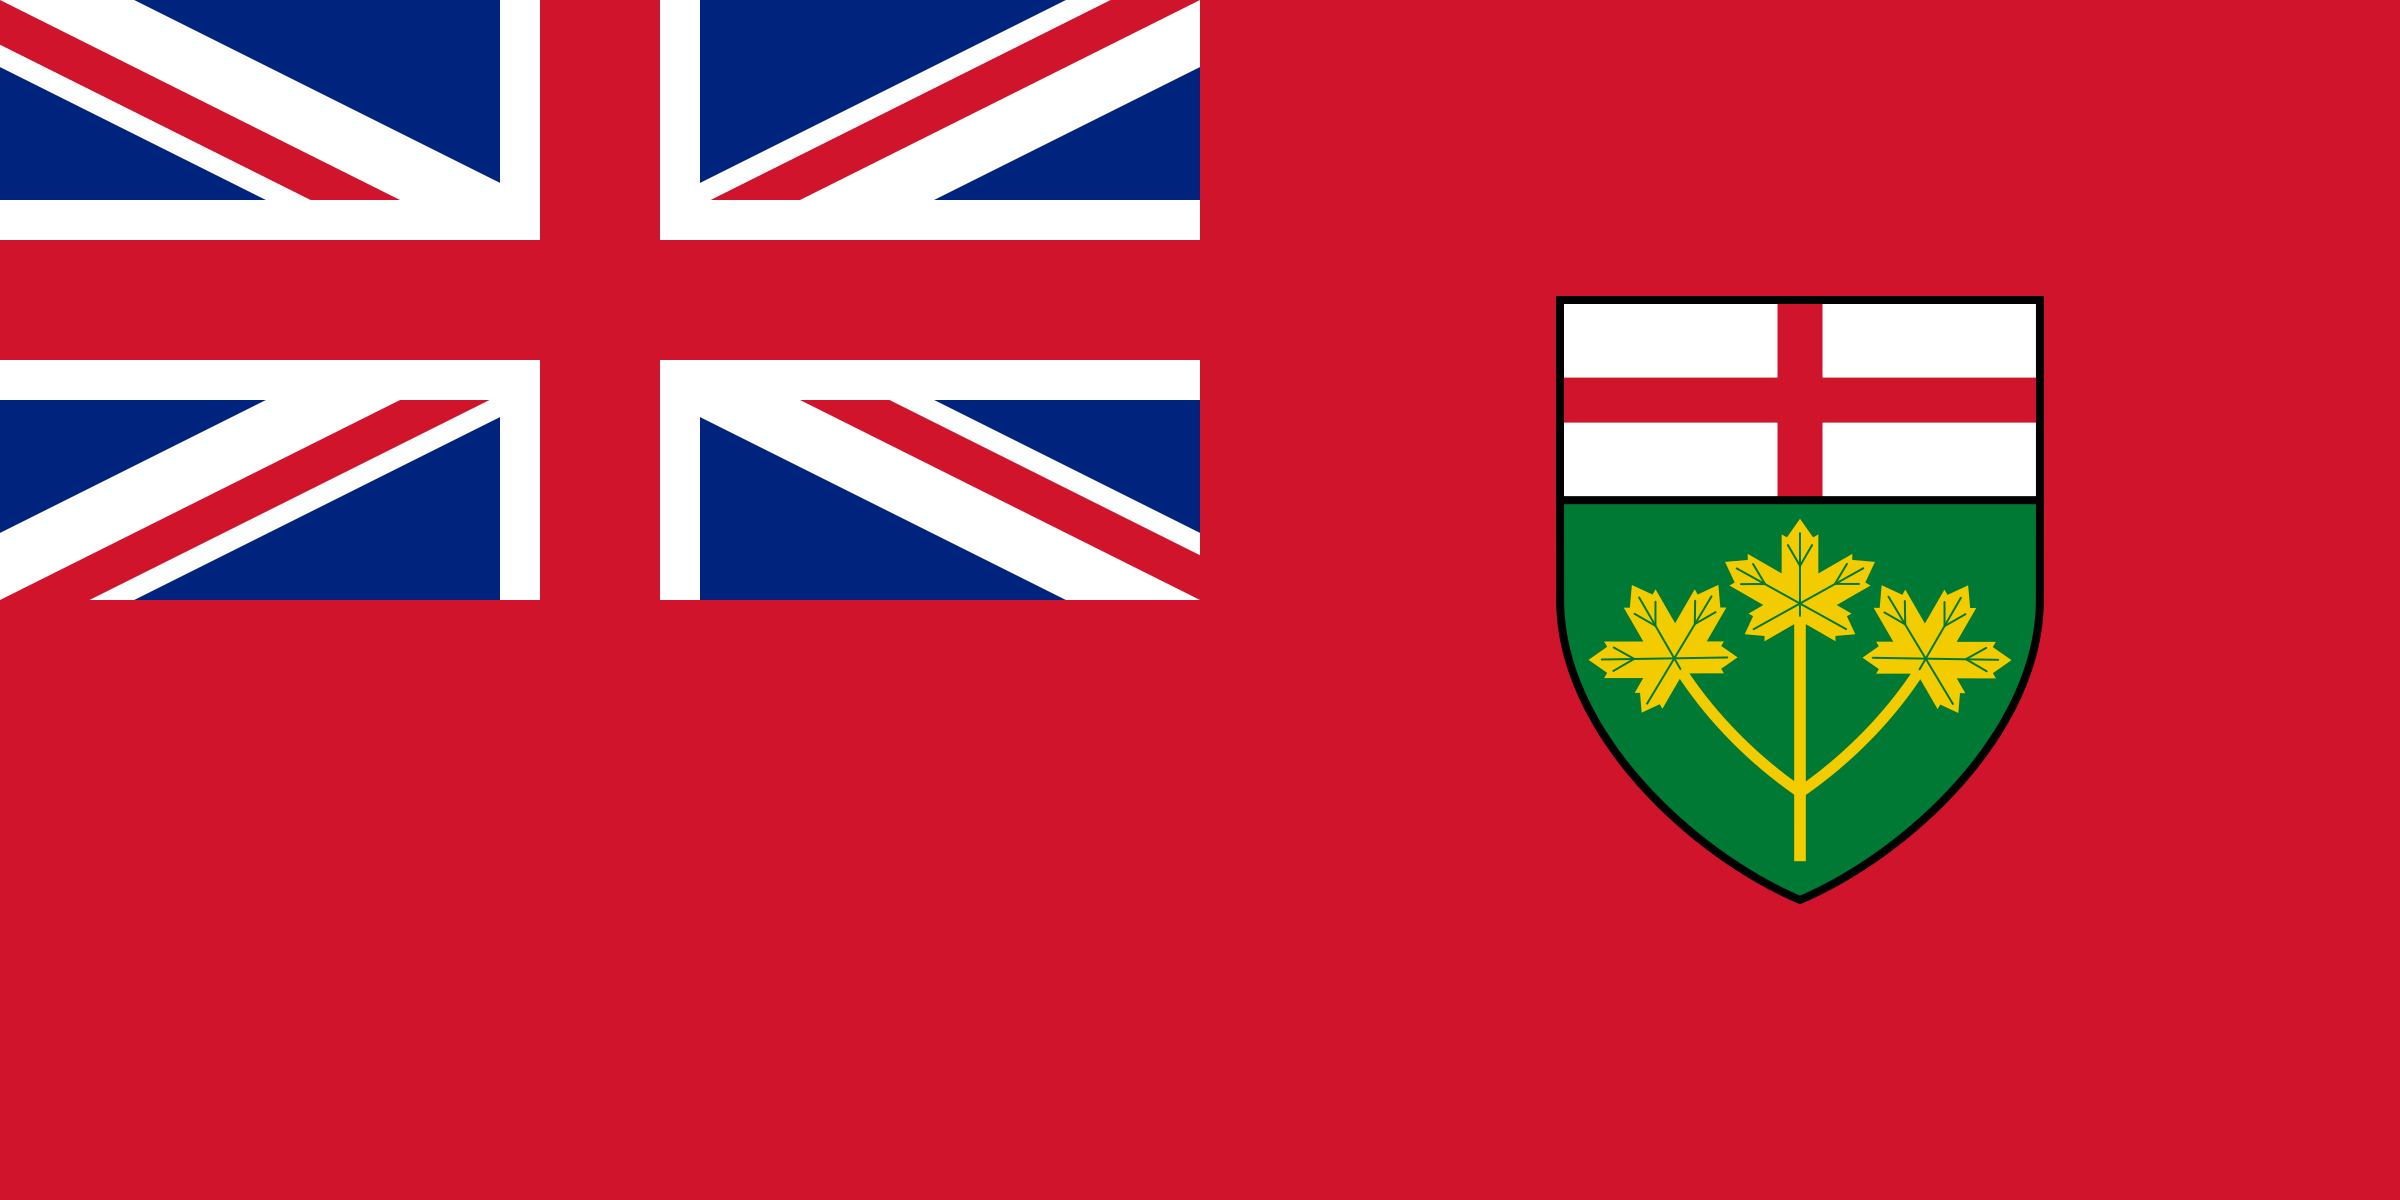 Ontario Ontario | $915.00 | $3,165.00 | $6,835.00 | vs QC |
| #10 | 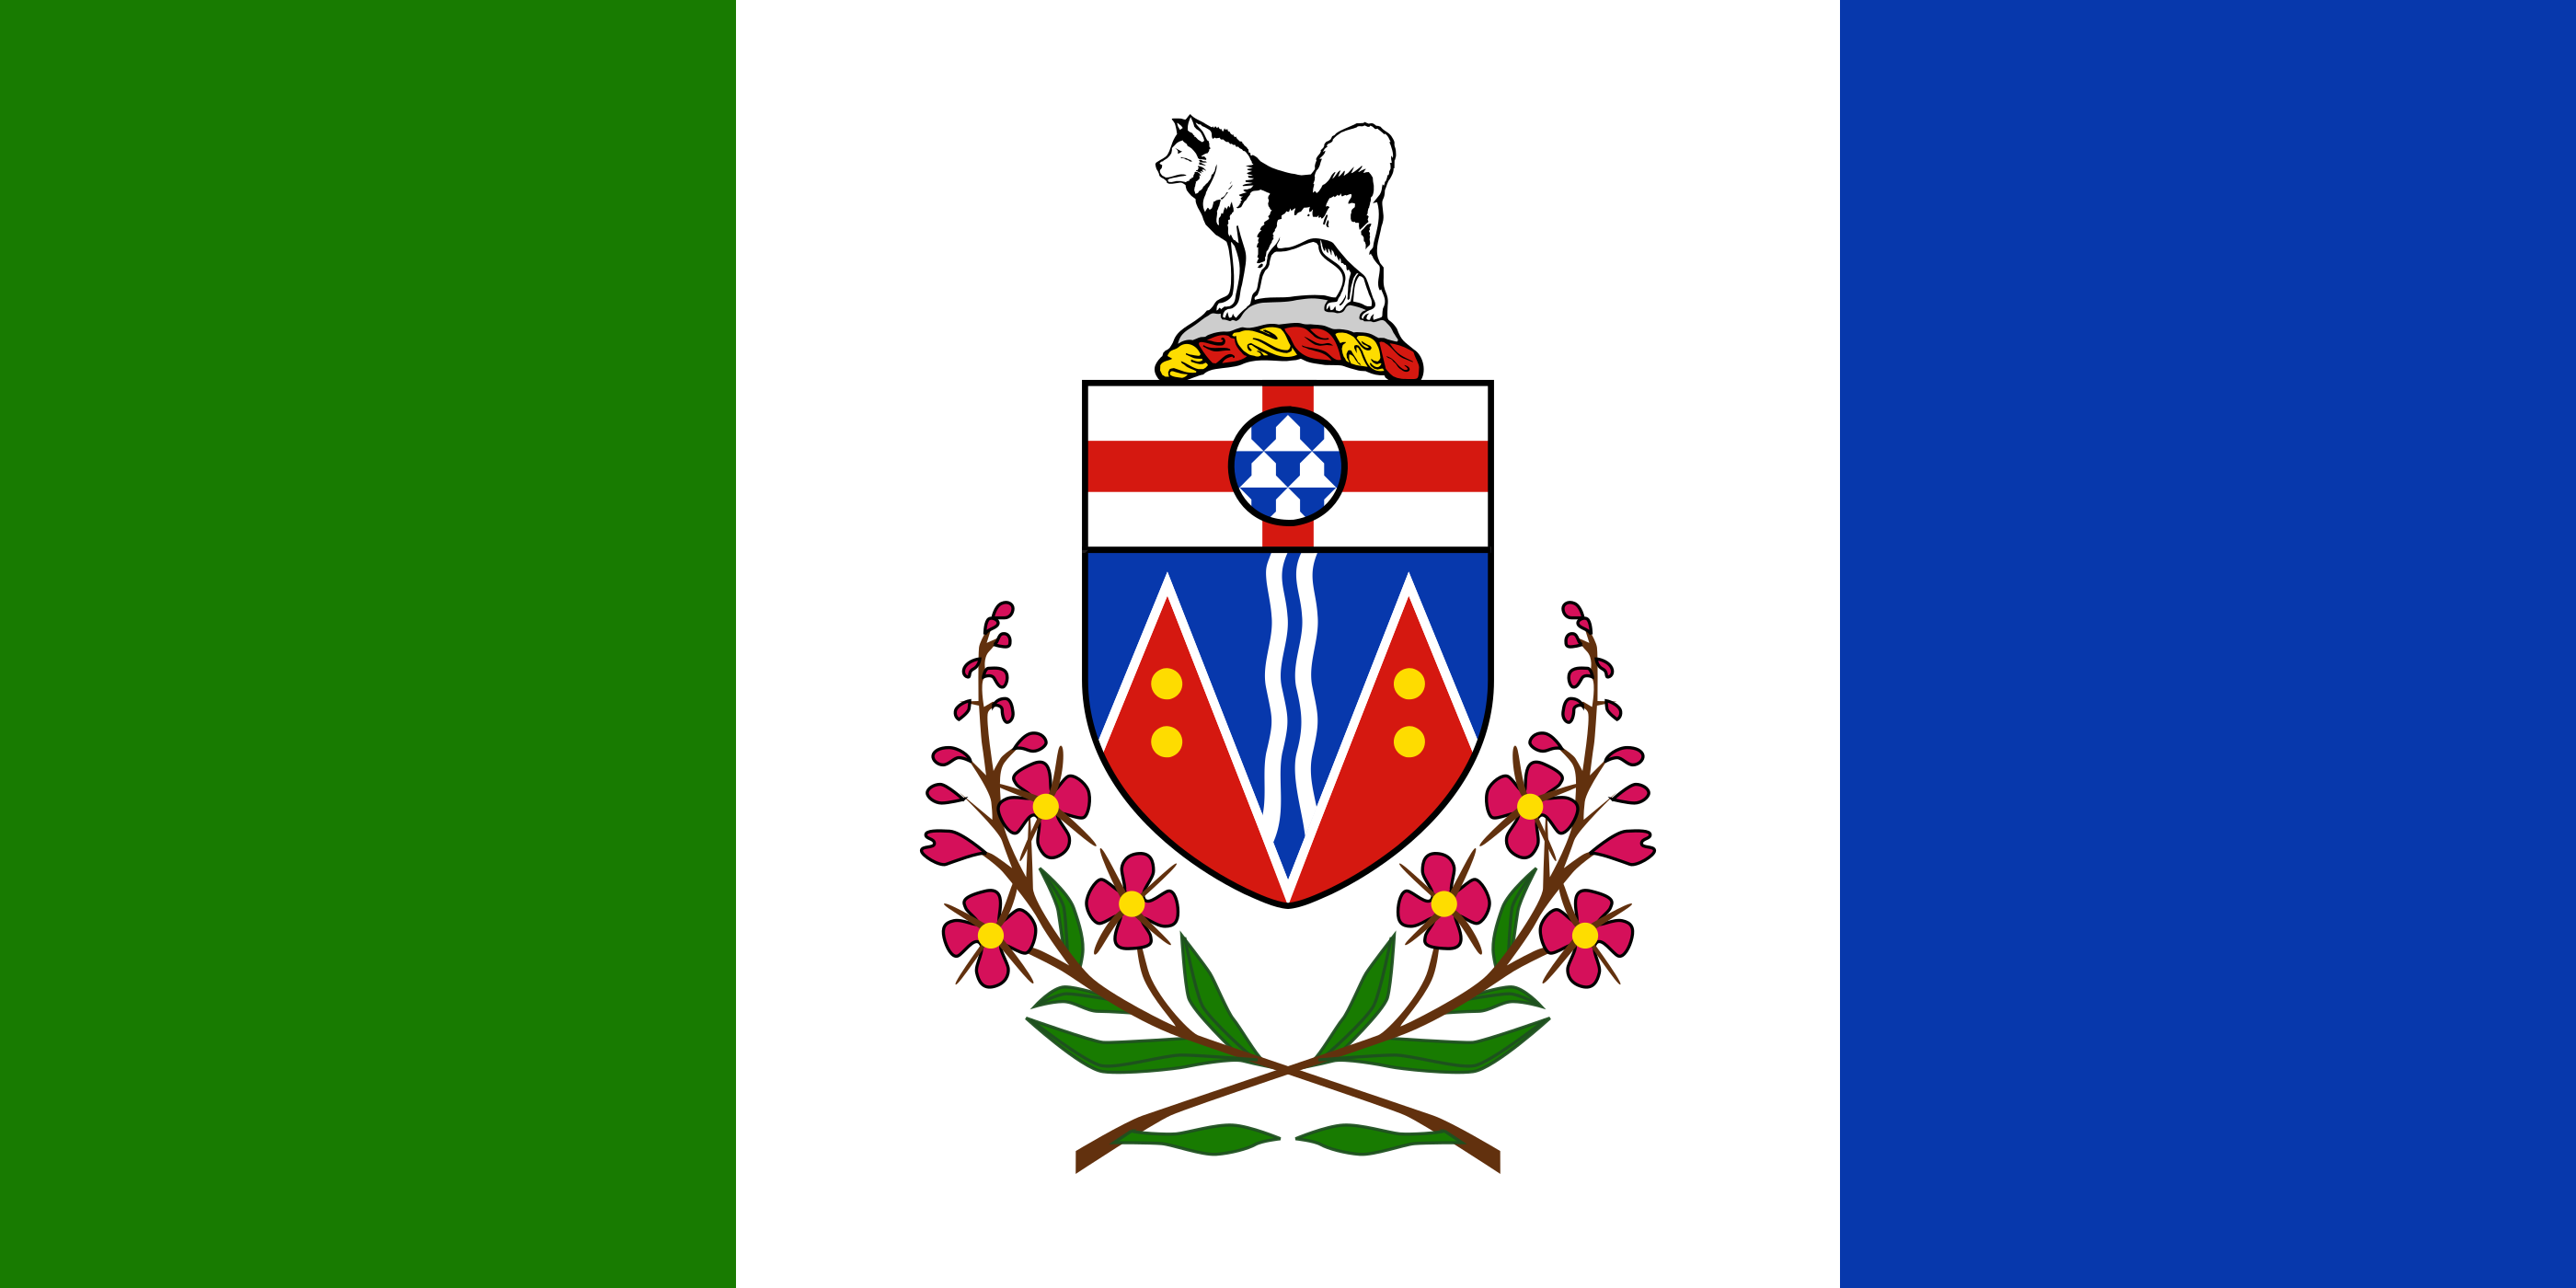 Yukon Yukon | $900.00 | $3,150.00 | $6,850.00 | vs NT |
| #11 | 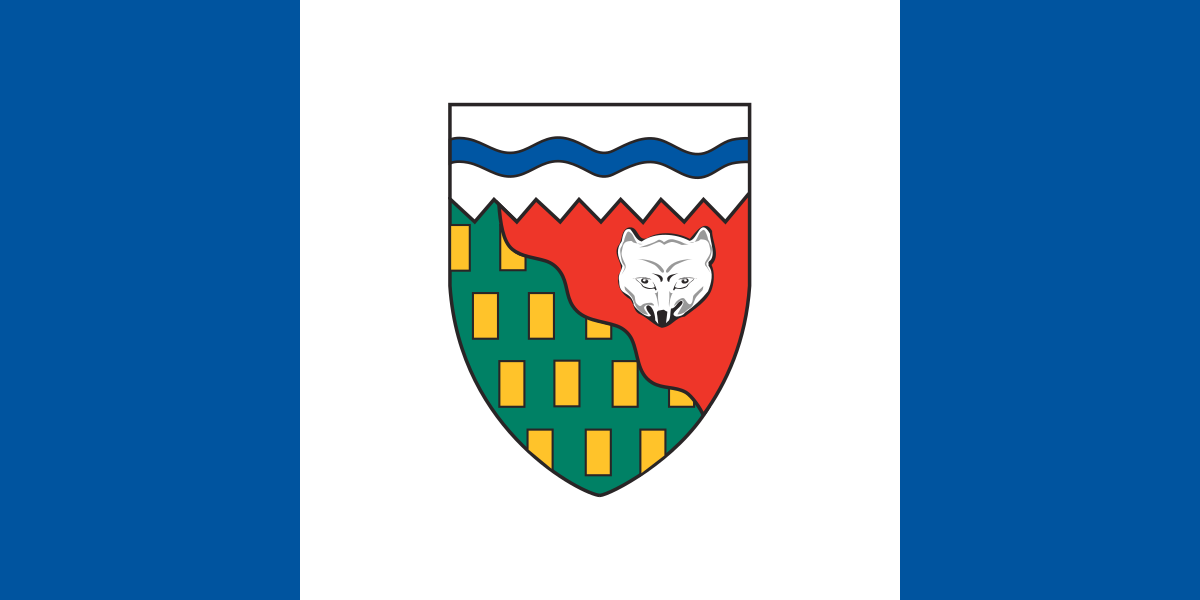 Northwest Territories Northwest Territories | $860.00 | $3,110.00 | $6,890.00 | vs BC |
| #12 | 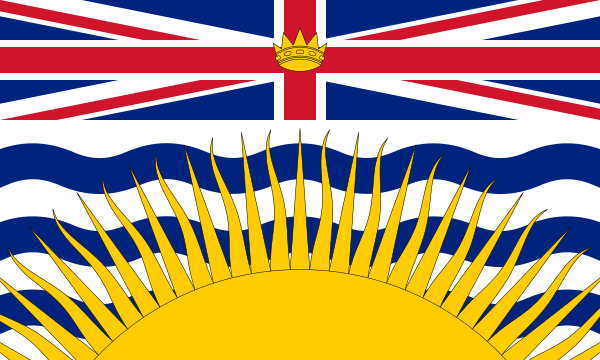 British Columbia British Columbia | $770.00 | $3,020.00 | $6,980.00 | vs AB |
| #13 |  Nunavut Nunavut | $700.00 | $2,950.00 | $7,050.00 | vs BC |
Nova Scotia
Provincial $1,667.00
$3,917.00
Rank #1
Prince Edward Island
Provincial $1,660.00
$3,910.00
Rank #2
Quebec
Provincial $1,900.00
$3,854.75
Rank #3
Newfoundland and Labrador
Provincial $1,458.40
$3,708.40
Rank #4
New Brunswick
Provincial $1,400.00
$3,650.00
Rank #5
Manitoba
Provincial $1,275.00
$3,525.00
Rank #6
Saskatchewan
Provincial $1,250.00
$3,500.00
Rank #7
Alberta
Provincial $1,000.00
$3,250.00
Rank #8
Ontario
Provincial $915.00
$3,165.00
Rank #9
Yukon
Provincial $900.00
$3,150.00
Rank #10
Northwest Territories
Provincial $860.00
$3,110.00
Rank #11
British Columbia
Provincial $770.00
$3,020.00
Rank #12
Nunavut
Provincial $700.00
$2,950.00
Rank #13
Featured
Ontario vs Quebec
Quebec +$689.75 total tax
Open comparisonOntario vs Alberta
Alberta +$85.00 total tax
Open comparisonBritish Columbia vs Alberta
Alberta +$230.00 total tax
Open comparisonOntario vs British Columbia
Ontario +$145.00 total tax
Open comparisonQuebec vs Alberta
Quebec +$604.75 total tax
Open comparisonNova Scotia vs New Brunswick
Nova Scotia +$267.00 total tax
Open comparisonManitoba vs Saskatchewan
Manitoba +$25.00 total tax
Open comparisonNewfoundland and Labrador vs Nova Scotia
Nova Scotia +$208.60 total tax
Open comparisonRanked by vignette total-tax gap among featured pairs (2026).
| # | Comparison | Higher tax in | Tax gap |
|---|---|---|---|
| 1 | Ontario vs Quebec | Quebec | $689.75 |
| 2 | Quebec vs Alberta | Quebec | $604.75 |
| 3 | Ontario vs Manitoba | Manitoba | $360.00 |
| 4 | Nova Scotia vs New Brunswick | Nova Scotia | $267.00 |
| 5 | Alberta vs Saskatchewan | Saskatchewan | $250.00 |
| 6 | British Columbia vs Alberta | Alberta | $230.00 |
| 7 | Newfoundland and Labrador vs Nova Scotia | Nova Scotia | $208.60 |
| 8 | Ontario vs British Columbia | Ontario | $145.00 |
| 9 | Ontario vs Alberta | Alberta | $85.00 |
| 10 | Manitoba vs Saskatchewan | Manitoba | $25.00 |
Top five provinces and territories by total incremental tax on the shared vignette.
Each province-vs-province page holds the bonus and salary fixed, then compares annual incremental tax and employee payroll premiums. Winner on total tax = higher modeled burden.
Federal + provincial income tax attributed to the bonus, plus employee payroll premiums on the incremental income.
Gross bonus minus modeled total tax — who keeps more after the annual incremental estimate.
The provincial (or territorial) income-tax slice; Quebec also changes federal tax via the Quebec abatement.
CPP/QPP, EI, QPIP (Quebec), and Ontario Health Premium when the bonus crosses an OHP slab.
Compare hub
This hub ranks all 13 provinces and territories on the same 2026 vignette and links head-to-head pair pages. Every dollar figure is recomputed from our Canada income-tax engine.
Unlike US supplemental withholding pages (flat federal rate plus state flats), Canada bonus pages attribute tax by comparing annual liability with and without the bonus.
Use rankings to shortlist provinces, then open a pair page for the scoreboard, ladder, myths, and province-specific payroll notes.
Method
Annual incremental tax answers “how much extra tax does this bonus add for the year?” It is useful for take-home planning and province comparisons.
CRA T4032 tables guide employers on how much to withhold from a lump-sum bonus cheque. That withholding can be higher or lower than the eventual T1 liability.
On this vignette, nets range from about $7,050.00 (Nunavut) to $6,083.00 (Nova Scotia).
Drivers
Provincial brackets and rates differ. Nova Scotia leads total tax at $3,917.00; Alberta is lighter at $3,250.00 provincial + federal combined on this vignette.
Quebec residents get a federal abatement but pay Revenu Québec tax plus QPIP — so federal and provincial lines both move versus other provinces.
Ontario Health Premium can jump when the bonus crosses an income slab even if the provincial bracket rate looks similar to a neighbour.
Limits
Employer payroll contributions, municipal taxes, stock options / RSUs, and non-cash benefits are outside the vignette.
Exact TD1 claim codes and mid-year bonus timing can change withholding without changing the annual estimate shown here.
US state comparisons use a different engine — open the US bonus tax by state hub for supplemental withholding rankings.
Planning guide
1
Sort by total tax on C$10,000 bonus on C$80,000 annual salary (single, no dependents). Rank #1 = highest tax burden.
2
Use the picker or a featured pair (e.g. Ontario vs Quebec). Both URL directions exist for priority pairs.
3
Compare total tax, provincial tax, payroll premiums, and net bonus side by side.
4
Pair pages show multiple bonus sizes — gaps can widen as the bonus pushes you into higher brackets.
5
Payroll may withhold more or less than the annual estimate. Plan cash flow; settle on filing.
6
Re-run any CAD bonus and salary on the Canada bonus tax calculator with the right province.
Quebec +$689.75 total tax. Open the scoreboard for federal, provincial, and payroll lines.
Open →Ontario $3,165.00 vs Alberta $3,250.00 — a common offer corridor.
Open →$3,917.00 total tax · $6,083.00 net on the vignette.
Open →$2,950.00 total tax · $7,050.00 net.
Open →Tax on (salary + bonus) minus tax on salary alone — the amount attributed to the bonus for ranking.
Total tax ÷ gross bonus. On this vignette Nova Scotia is about 39.2%.
When salary already sits near YMPE/YAMPE, a mid-year bonus can still create CPP2 / QPP second-tier premiums.
How much more take-home one province keeps on the same gross bonus and salary assumptions.
Myth: Canada uses the same 22% bonus tax as the US.
Fact: No. US pages model flat supplemental withholding. Canada pages model annual incremental federal + provincial tax plus payroll premiums.
Myth: Federal tax on a bonus is identical in every province.
Fact: Quebec’s federal abatement changes the federal line. On this vignette Ontario federal tax is $2,050.00 vs Quebec $1,711.75.
Myth: Payroll premiums never matter for bonus rankings.
Fact: They do. Example — Ontario payroll on the vignette: CPP $200.00. Quebec also includes QPIP.
Myth: The highest-tax province on the vignette is always highest for every salary.
Fact: Bracket cliffs and OHP slabs can reorder neighbours at other incomes. Re-run the calculator with your numbers.